Kumtor’s Basic Operating Results in 2013
published: 14 March 2014
Basic Operating and Financial Results
At the Kumtor mine gold production in 2013 was 600,402 ounces1 or 18,674.6 kg. Gold sales in 2013 were 601,887 ounces or 18,720.8 kg with a revenue totaling $810.9million2. The table below displays Kumtor’s basic operating and financial results:
Three Months Ended December 31 |
Year Ended December 31 |
|||||
|---|---|---|---|---|---|---|
2013 |
20126 |
Change |
2013 |
20126 |
Change |
|
| Revenue from gold sales to Kyrgyzaltyn – $ millions2 | 448,9 | 317,8 | 41% | 810,9 | 533,6 | 52% |
| Cost of sales3 – $millions | 255,1 | 140.0 | 82% | 437.0 | 306,9 | 54% |
| Cost of sales4 – $/oz | 722 | 753 | (4%) | 786 | 974 | (19%) |
| Tonnes mined – 000s | 46 866 | 38 185 | 23% | 176 693 | 147 610 | 20% |
| Tonnes ore mined – 000s | 4 194 | 4 463 | (6%) | 7 289 | 4 955 | 47% |
| Tonnes milled – 000s | 1 460 | 1 547 | (6%) | 5 596 | 4 756 | 18% |
| Average mill head grade – g/t | 8,88 | 5,13 | 73% | 4,26 | 2,79 | 53% |
| Recovery – % | 84,1 | 77,7 | 8% | 79,3 | 75,6 | 5% |
| Gold produced – ounces | 348 130 | 189 438 | 84% | 600 402 | 315 238 | 90% |
| Gold produced – kg | 7 717,7 | 5 892,2 | 84% | 18 674,6 | 9 805,0 | 90% |
| Gold sold – ounces | 353 252 | 185 936 | 90% | 601 887 | 314 987 | 91% |
| Gold sold – kg | 10 987,4 | 5 783,3 | 90% | 18 720,8 | 9 797,2 | 91% |
| Average realized gold price4 – $/oz | 1 271 | 1 709 | (26%) | 1 347 | 1 694 | (20%) |
| Adjusted operating costs4 – $/oz | 217 | 322 | (33%) | 357 | 727 | (51%) |
| All-in sustaining costs4 – $/oz | 388 | 618 | (37%) | 775 | 1 483 | (48%) |
| All-in costs4 – $/oz | 407 | 783 | (48%) | 853 | 2 064 | (59%) |
| All-in costs including taxes4 – $/oz | 585 | 1 023 | (43%) | 1 042 | 2 301 | (55%) |
| Capital expenditures (sustaining) – $millions | 9,6 | 10,5 | (9%) | 49,7 | 40,8 | 22% |
| Capital expenditures (growth)5 – $millions | 5,8 | 24 | (76%) | 39,2 | 167,6 | (77%) |
(1) One Troy ounce equals to 31,10348 grammes.
(2) Unless specified otherwise, all dollar figures in this news release are in US dollars.
(3) Cost of sales does not include regional office administrative expenses.
(4) In 2013, the Company adopted non-GAAP performance measures recommended by the World Gold Council. See discussion under “Non-GAAP Measures” in Centerra’s news release of February 19, 2014).
“Adjusted operating costs”, “all-in sustaining costs”, “all-in cash costs” pre-tax and including tax as well as “average realized price” and “cost of sales” per ounce sold are non-GAAP measures.
(5) Excludes capitalized stripping.
(6) The 2012 comparative period was restated as a result of the adoption of IFRIC 20.
Reserves and Resources
Updated estimates on reserves and resources at Kumtor as at December 31, 2013, were disclosed in Centerra’s news release from February 5, 2014. Kumtor’s proven and probable mineral reserves total 8.51 million ounces of contained gold as of December 31, 2013 after processing 766,000 contained ounces in 2013. Kumtor’s life-of-mine plan is based only on the open pit reserves, and no provision has been made for production from the underground resources.
2013 year-end reserves and resources are shown in the table below:
Reserves and resources at Kumtor as of December 31, 20131 |
Thousands of tonnes |
Grade(g/t) |
Contained gold |
|
|---|---|---|---|---|
Thousands of oz |
Tonnes |
|||
| Gold reserves: | ||||
| – proven3 | 4 841 | 1,9 | 296 | 9,20 |
| – robable3 | 80 345 | 3,2 | 8 220 | 255,68 |
| Total Reserves | 85 186 | 3,1 | 8 516 | 264,88 |
| Resources: | ||||
| – measured3 | 21 975 | 2,3 | 1 631 | 50,73 |
| – indicated3 | 12 113 | 2,3 | 898 | 27,93 |
| – indicated Stockwork UG2,4 | 351 | 10,7 | 121 | 3,76 |
| Total Measured and Indicated Resources | 34 439 | 2,4 | 2 650 | 82,42 |
| Inferred Resources | ||||
| – ц- Central Pit, Southwest, Sarytor and Northern deposits3 | 9 339 | 2,4 | 712 | 22,14 |
| – Underground Stockwork Zone4 | 2 002 | 11,0 | 705 | 21,93 |
| – Underground SB Zone4 | 3 413 | 11,2 | 1 229 | 38,23 |
| Total Inferred Resources | 14 754 | 5,6 | 2 646 | 82,30 |
(1) The reserves and resources include those of the open-pit area as well as of the Southwest, Sarytor and Northeast deposits and have been estimated based on a gold price of US$1,300 per ounce.
(2) “OP” means open pit and “UG” means underground.
(3) The open pit reserves and resources are estimated on a cut-off grade of 0.85 g/t for the Central Pit and 1.0 g/t for the Southwest, Sarytor and Northeast deposits.
(4) Underground resources occur below the Central Pit and are estimated based on a cut-off grade of 6.0 g/t.
The reserves and resources estimated by Centerra are determined in accordance with National Instrument 43-101 which is the same standard used by many international mining companies.Such reserve and resource estimates are based on mining operations continuing until the end of the current life of mine plan in 2026 and do not consider potential mining activities after that time. These estimates also formed the basis of Centerra’s discussions with the Government of the Kyrgyz Republic when they entered into the non-binding Heads of Agreement on the Kumtor Restructuring.
Payments to the Kyrgyz National Budget and Mandatory Contributions
During the twelve months of 2013, contributions to the national budget in taxes, deductions to the Social Fund and other mandatory payments exceeded $108 million, which according to the KR National Bank’s exchange rate as at December 31, 2013, amounts to approximately 5.350 billion soms.
As of December 31, 2013 |
USD thousands |
|---|---|
| Revenue-based tax | 73 595,61 |
| Issyk-Kul Development Fund | 7 838,01 |
| Pollution tax | 310,00 |
| Employee Income tax | 4 363,09 |
| Social Insurance Fund | 20 608,90 |
| Customs | 1 122,21 |
| Tax on nonresident companies | 678,88 |
| Other taxes and mandatory payments | 77,49 |
| Total |
108 594,19 |
| US$ official exchange rate to the Kyrgyz Soms as of December 31, 2013 |
49,2470 |
| Equivalent of payments effected in million Kyrgyz Soms | 5 347 938,07 |
Note: Under the Agreement on New Terms dated as of April 24, 2009, the revenue-based tax and contributions to the Issyk-Kul Region Development Fund are estimated based on actual cash revenues from sales during the period under review.
Payments within the Kyrgyz Republic
Contributions made within the Kyrgyz Republic in 2013 (including taxes, refining, domestic suppliers, infrastructure, charities, etc.) have exceeded $270 million.
In all, contributions made within the Kyrgyz Republic between 1994 and 2013 have exceeded $2.424 billion.
USD millions |
2013 |
1994 – 2013 |
|---|---|---|
| Taxes, customs & other mandatory payments | 79,875 | 707,328 |
| Social Insurance Fund | 20,609 | 112,971 |
| Issyk-Kul Development Fund | 7,838 | 35,512 |
| Licenses & permits | 0,300 | 2,579 |
| Pollution tax and payments to the Environment Protection Agency | 0,310 | 4,059 |
| Payments to Kyrgyzaltyn | 0,254 | 11,675 |
| Refinery | 4,372 | 40,453 |
| Revenue from the sale of Centerra shares | – | 86,000 |
| Dividends | 11,902 | 65,438 |
| Purchases in the Kyrgyz Republic: – supplies & services |
50,801 | 587,815 |
| – foods | 5,307 | 51,778 |
| Kyrgyz-infrastructure-related payments: – electricity |
11,253 | 130,593 |
| – roads outside the mine site | 2,186 | 37,519 |
| – Tamga-Kumtor power-transmission line | – | 41,612 |
| KOC employees’ net wage | 69,358 | 448,010 |
| Sanatoria treatment | – | 0,744 |
| Education, scholarships & training | 0,072 | 3,911 |
| Sponsorships & sustainable development projects | 5,935 | 20,927 |
| Government contributions | – | 31,000 |
| Payments to communities | – | 4,400 |
| Total |
270,372 | 2 424,32 |
Assistance to the KR Government in Implementation of Social Projects
To optimize sponsorships from Kumtor Gold Company, the Government of the KR in November 2013 decided to choose Ayil Bank as the agent of the easy microcrediting project for rural residents through the special credit product Kumtor-Chakan. KGC-sponsored funds transferred from Ala-Too Finance to Ayil Bank are approximately 808 million soms. A further approximately 70 million soms was transferred as an operating credit portfolio to a group of regional microcrediting agencies.
Kumtor’s Impact on the Macroeconomic Performance of the Kyrgyz Republic
According to preliminary reports of the KR National Statistics Committee,
• Kumtor’s share in KR GDP in 2013 was 7,7%;
• Kumtor’s share in the aggregate industrial output was 24,0%;
• Gold’s share in the national exports in 2013 was 36,5%.
2014 Outlook
The Kumtor mine estimates it will produce between 550,000 and 600,000 ounces or 17.1 to 18.7 tonnes of gold in 2014 and similar to 2013, over 50% of this gold production is expected during the fourth quarter when mining will reach the high-grade section of the SB Zone.
The projected capital expenditures for 2014, excluding capitalized stripping, are estimated to be $85 million of which $42 million will be spending on sustaining capital, including the major overhaul maintenance of the mine equipment, purchase of ball mill girth gear, tailings dam construction raise and other items. Growth capital investment at Kumtor is forecast at $43 million and includes the relocation of certain infrastructure at Kumtor related to the KS-13 life-of-mine expansion plan, dewatering projects and purchase of new mining equipment.
Capitalized stripping costs (cash) are expected to be $191 million in 2014.
●●●
The Kumtor open pit mine, located in the Kyrgyz Republic, is the largest gold mine in Central Asia operated by a Western-based producer. It has been in operation since May 1997 and, as of December 31, 2013, has produced approximately 8.9 million ounces or 279 tonnes of gold.
Kumtor Gold Company is the operator of the Kumtor project responsible for the entire production cycle.
Centerra Gold Inc. (Centerra) is a gold mining company focused on operating, developing, exploring and acquiring gold properties primarily in Asia, the former Soviet Union and other markets worldwide. Centerra is a leading North American-based gold producer and is the largest Western-based gold producer in Central Asia. Centerra’s shares trade on the Toronto Stock Exchange (TSX) under the symbol CG. The Company is headquartered in Toronto, Ontario, Canada.
Additional information on Centerra and the full text of the news release on the 4th quarter and basic operating results of 2013 are available on SEDAR at www.sedar.com and www.centerragold.com. Information on KOC is available at www.kumtor.kg
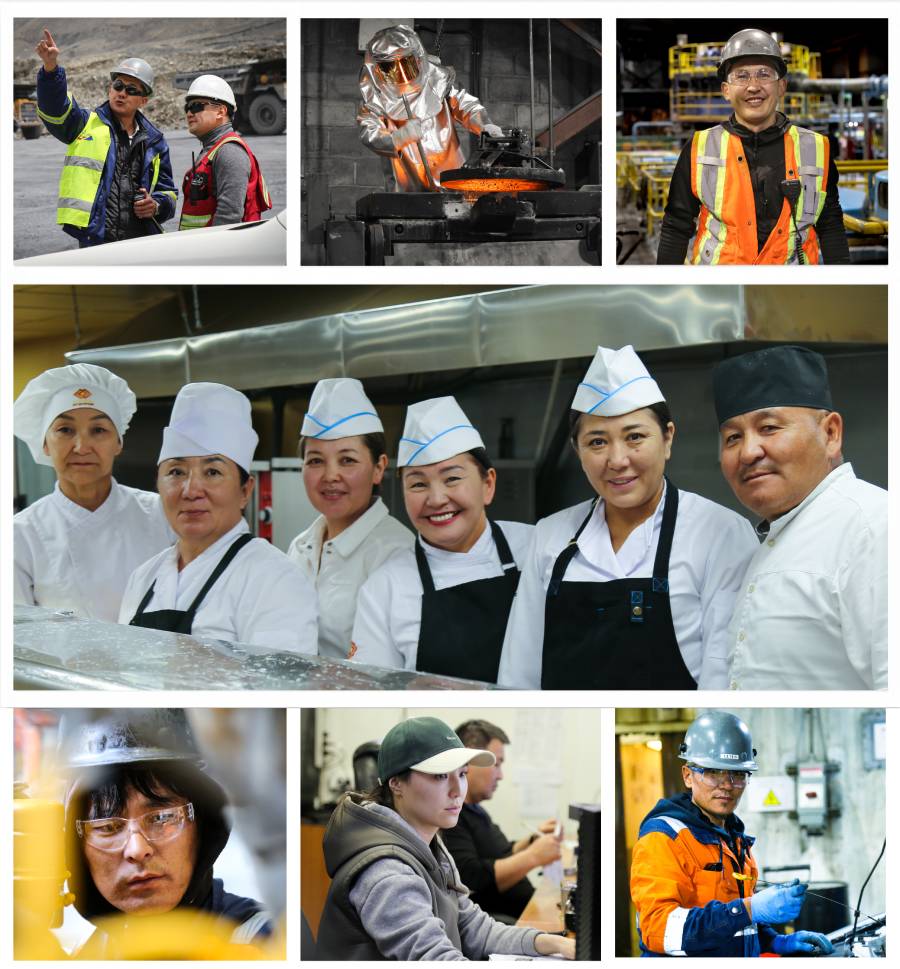
Kumtor Gold Company provides jobs for over 3000 people.
99 percent of the Company full-time employees are Kyrgyz citizens, and this proportion is ever growing as the result of foreign managerial personnel being gradually replaced by national employees.
WORKFORCE
As of 31.05.2026, according to the HR management system, the Kumtor Gold Company has
3 579
Full-time
employees

8
Expatriate specialists
3 571
Citizens of the Kyrgyz Republic

Latest news
- KUMTOR: MORE THAN USD 1.2 BLN CONTRIBUTED TO THE STATE BUDGET DURING 4.5 YEARS OF STATE MANAGEMENT
- VIDEO – HAPPY METALLURGISTS’ DAY!
- KUMTOR TRANSFERRED KGS 19 BLN TO THE STATE BUDGET DURING THE FIRST SIX MONTHS OF 2026
- KANIMET TOKTOSUNOV: THE EPC CONTRACTOR FOR THE CONSTRUCTION OF THE TOGOLOK DEPOSIT FACILITIES IS CHINA NERIN ENGINEERING
- SPECIAL EDITION: TOGOLOK