Operating Results of the 2nd Quarter of 2017
published: 16 August 2017
Centerra Gold Inc. (Centerra) and Kumtor Gold Company (KGC) have summed up their operating results in the second quarter of 2017. In the first six months of 2017, KGC produced 266,023 ounces¹ or 8274.25 kg of gold and contributed more than 4.7 billion soms in taxes and mandatory payments.
Gold Production and Sales
During the second quarter of 2017, Kumtor produced 138,623 ounces of gold compared to 97,724 ounces of gold in the comparative period of 2016. The increase in ounces poured is a result of processing higher grade ore from stockpiles which were mined in the Central pit in cut-back 17 in previous years, compared to the lower grade ore mined and processed from the initial benches in cut-back 17 during the comparative period. During the second quarter of 2017, Kumtor’s average mill head grade was 3.53 g/t with a recovery of 79.3%, compared to 2.63 g/t and a recovery of 71.9% for the same period of 2016.
Gold sales in the second quarter of 2017 were 135,235 ounces, or 4.21 tonnes. Total revenues from gold sales in the second quarter of 2017 were $168.6 million2.
The Dore bars produced by the Kumtor mine are purchased by Kyrgyzaltyn JSC for processing at the Kara-Balta refinery pursuant to a Gold and Silver Sales Agreement signed by KGC, Kyrgyzaltyn and the Government of the Kyrgyz Republic. Kyrgyzaltyn JSC enjoys the exclusive right to sell refined gold and silver both in and outside the Kyrgyz Republic.
Operating costs and All-in Measures:
Operating costs (on a sales basis) for the second quarter of 2017 decreased by $22.2 million to $39.3 million, as compared to the same quarter of 2016, reflecting 23% more tonnage moved including significant amount of waste removal in cut-back 18 which were capitalized in the second quarter of 2017. Including capitalized stripping, operating costs were $86.7 million compared to $80.5 million in the comparative second quarter of 2016. The increase in the major components of operating costs (mining, milling and site support) before changes in inventory is explained below.
Mining Costs, including capitalized stripping (Second Quarter 2017 compared to Second Quarter 2016):
Mining costs, including capitalized stripping, totaled $48.2 million in the second quarter of 2017, which was $1.3 million higher than the comparative quarter of 2016. Increased costs for the second quarter of 2017 includes higher maintenance cost ($1.1million) resulting from higher repairs on the Liebherr shovels and dozers, and higher labour cost ($1.0 million) due to collective agreement increases and strengthening of the Kyrgyz som in comparison to the comparative period. This was partially offset by lower tire costs ($1.0 million) due to both lower tire consumption and lower purchase price for truck tires.
Milling Costs (Second Quarter 2017 compared to Second Quarter 2016):
Milling costs of $16.5 million in the second quarter of 2017 compared to $15.7 million in the comparative quarter of 2016. Milling costs were higher than the comparative period due to the timing of the liner replacements and associated maintenance that were required during the replacement of the SAG and regrind mill liners during the second quarter of 2017, not performed in the comparative period in 2016. This was partially offset by lower cyanide costs ($0.8 million) resulting from lower consumption and a lower purchase price.
Site Support Costs (Second Quarter 2017 compared to Second Quarter 2016):
Site support costs in the second quarter of 2017 totaled $11.3 million compared to $10.9 million in the comparative quarter in 2016. Site support costs increased slightly due to higher labour costs resulting from the collective agreement and strengthening of local currency in comparison to the comparative period, and upgrading on-site systems infrastructure to maximize the mine productivity improvement projects.
Other Cost movements:
All-in sustaining costs on a by-product basis per ounce sold4, which excludes revenue-based tax, was $780 for the second quarter of 2017 compared to $768 in the second quarter of 2016, representing an increase of 2%. The increase results from $28.5 million higher stripping capital as the mine focused on stripping cut-back 18 and the Sarytor pit in the second quarter of 2017, which offset the benefit from processing lower cost stockpiled ore from the lower benches of cut-back 17.
Including revenue-based taxes, all-in sustaining costs on a by-product basis per ounce sold4 was $956 for the second quarter of 2017 compared to $945 in the second quarter of 2016. The increase is due to the higher all-in sustaining costs (explained above).
Operating Results of the Kumtor Project
| Unaudited ($ millions, except as noted) | Three Months Ended June 30 | Six Months Ended June 30 | ||||
|---|---|---|---|---|---|---|
| 2017 | 2016 | % Change | 2017 | 2016 | % Change | |
| Revenue from gold sales to Kyrgyzaltyn – $ millions2 | 168.6 | 161.6 | 4% | 332.8 | 234.8 | 42% |
| Cost of sales – $millions | 80.3 | 118 | (32%) | 152.6 | 149.5 | 2% |
| Cost of sales – $/oz sold | 594 | 923 | (36%) | 565 | 788 | (28%) |
| Tonnes mined – 000s | 42,855 | 34,744 | 23% | 81,857 | 74,018 | 11% |
| Tonnes ore mined – 000s | 12 | 2,891 | (100%) | 12 | 4,717 | (100%) |
| Tonnes milled – 000s | 1,537 | 1,609 | (4%) | 3,072 | 3,151 | (3%) |
| Average mill head grade – g/t | 3.53 | 2.63 | 34% | 3.53 | 2.46 | 44% |
| Recovery – % | 79.3% | 71.9% | 10% | 77.6% | 73.3% | 6% |
| Gold produced – ounces1 | 138,623 | 97,724 | 42% | 266,023 | 184,168 | 44% |
| Gold produced – kg | 4311.66 | 3039.56 | 42% | 5,728.27 | 8,907.51 | 44% |
| Gold sold – ounces1 | 135,235 | 127,909 | 6% | 269,917 | 189,654 | 42% |
| Gold sold – kg | 4206.28 | 3978.42 | 6% | 8395.36 | 5898.90 | 42% |
| Average realized gold price4 – $/oz sold | 1,247 | 1,264 | (1%) | 1,233 | 1,238 | 0% |
| Capital expenditures (sustaining)4 – cash | 13.5 | 13.6 | (1%) | 28.7 | 36.6 | (22%) |
| Capital expenditures (growth)4 – cash | 4.9 | 5.4 | (10%) | 5.8 | 10.1 | (43%) |
| Capital expenditures (stripping)4 – cash | 47.4 | 18.9 | 151% | 94.2 | 29.3 | 221% |
| Operating costs (on a sales basis)4 | 39.3 | 61.5 | (36%) | 77.2 | 80.4 | (4%) |
| Adjusted operating costs4 – $/oz sold | 329 | 511 | (36%) | 315 | 466 | (32%) |
| Gold – All-in sustaining costs on a by-product basis – $/oz sold4 | 780 | 768 | 2% | 771 | 817 | (6%) |
1 – One Troy ounce equals to 31.103 48 grammes.
2 – Unless specified otherwise, all dollar figures in this news release are in US dollars.
3 – Numbers may not add up due to rounding
4 – Adjusted operating costs, all-in sustaining costs on a by-product basis (including and excluding taxes), cash provided by operations before changes in working capital, as well as average realized gold price per ounce sold and capital expenditures (sustaining and growth) are non-GAAP measures and are discussed under “Non-GAAP Measures”.
Payments to the Kyrgyz National Budget and Mandatory Contributions
During the second quarter of 2017, contributions to the national budget in taxes, deductions to the Social Fund and other mandatory payments have totaled 2.5 billion soms.
Kumtor’s Contributions in Taxes and Mandatory Payments for the First Six Months of 2017
| As of June 30, 2017 | USD |
|---|
| Revenue-based tax | 50,209,383 |
|---|---|
| Issyk-Kul Development Fund | 3,862,260 |
| Pollution tax | 310,000.00 |
| Employee Income tax | 2,418,903 |
| Social Insurance Fund | 10,658,357 |
| Customs | 288,207 |
| Tax on nonresident companies | 321,232 |
| Other taxes and mandatory payments | 351,597 |
| Total | 68,419,939 |
| US$ official exchange rate to the Kyrgyz Soms as of June 30, 2017 | 69.1367 |
| Equivalent of payments effected in thousands Kyrgyz Soms | 4,730,328,788.65
|
Note: Under the Agreement on New Terms dated as of April 24, 2009, the revenue-based tax and contributions to the Issyk-Kul Region Development Fund are estimated based on actual cash revenues from sales during the period under review.
Commentary
Scott Perry, CEO of Centerra Gold stated, “During the second quarter we continued to deploy our Company-wide safety leadership program “Work Safe, Home Safe” to all our sites, but as we reported on in the first quarter report this was over shadowed by a fatality in early April at Kumtor.
With our second quarter earnings release today, the Company increased its gold production guidance for Kumtor for the year to 525,000 – 555,000 ounces. We also lowered our expected all-in sustaining cost4 guidance at Kumtor to $751 to $795 per ounce sold. We are well positioned to achieve our revised gold production and cost guidance for the year, ranking the Company in the bottom quartile on the global gold producers All-In Sustaining Cost curve.”
***
The Kumtor open pit mine, located in the Kyrgyz Republic, is the largest gold mine in Central Asia operated by a Western-based producer. It has been operating since May 1997 and, as of June 30, 2017, has produced approximately 11.203 million ounces or 348.455 tonnes of gold.
Kumtor Gold Company is the operator of the Kumtor Project responsible for the entire production cycle.
Centerra Gold Inc. is a Canadian-based gold mining company focused on operating, developing, exploring and acquiring gold properties in North America, Asia and other markets worldwide. Centerra is a leading Canadian-based gold producer and is one of the largest Western-based gold producers in Central Asia. Centerra’s principal operations are the Kumtor Project located in the Kyrgyz Republic and the Mount Milligan Mine located in British Columbia, Canada.
Centerra’s shares trade on the Toronto Stock Exchange (TSX) under the symbol CG. The Company is headquartered in Toronto, Ontario, Canada.
The Kyrgyz Republic, via Kyrgyzaltyn JSC, is Centerra’s largest shareholder owning 77,401,766 shares as of August 16, 2017, Kyrgyzstan’s interests were estimated at $ 425 million.
Additional information on Centerra and the full text of the news release on the results of the second quarter of 2017 are available on SEDAR at www.sedar.com and the corporate websites at www.centerragold.com and www.kumtor.kg.
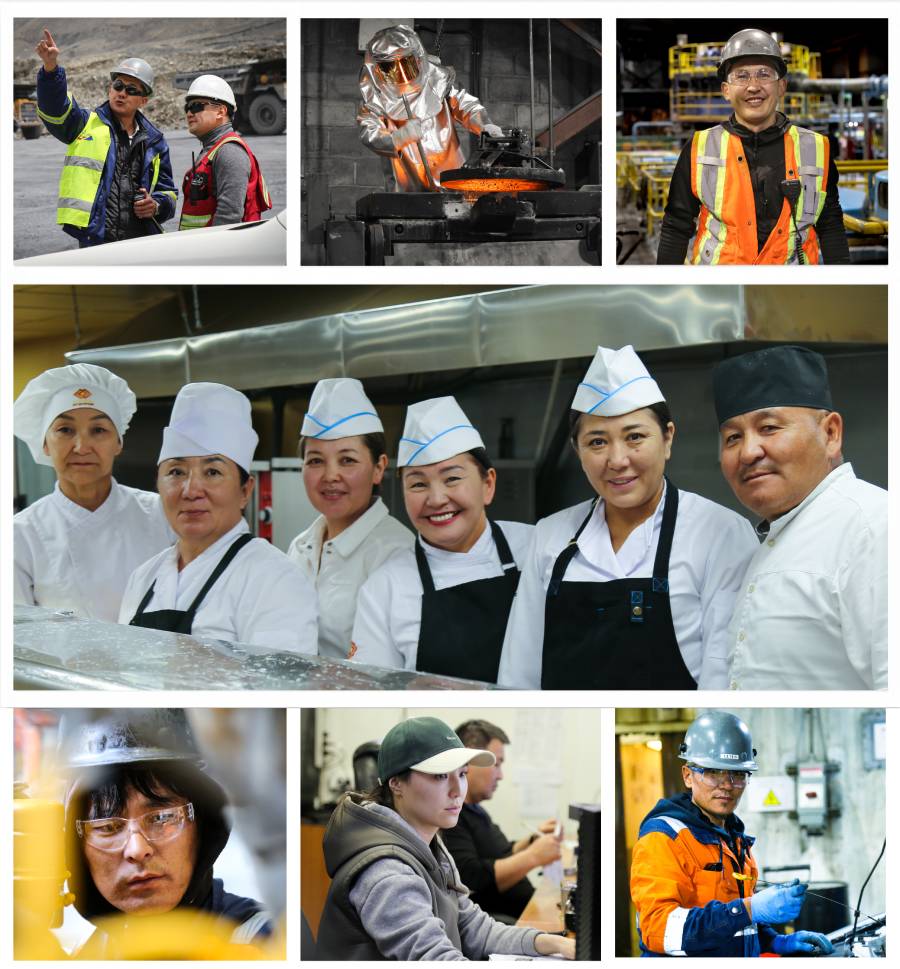
Kumtor Gold Company provides jobs for over 3000 people.
99 percent of the Company full-time employees are Kyrgyz citizens, and this proportion is ever growing as the result of foreign managerial personnel being gradually replaced by national employees.
WORKFORCE
As of 31.05.2026, according to the HR management system, the Kumtor Gold Company has
3 579
Full-time
employees

8
Expatriate specialists
3 571
Citizens of the Kyrgyz Republic

Latest news
- KANIMET TOKTOSUNOV: THE EPC CONTRACTOR FOR THE CONSTRUCTION OF THE TOGOLOK DEPOSIT FACILITIES IS CHINA NERIN ENGINEERING
- SPECIAL EDITION: TOGOLOK
- AMBASSADOR NICHOLAS BOWLER HAS VISITED KUMTOR MINE OPERATIONS
- PHOTO REPORT — BALYKCHY MARSHALLING YARD: A NEW STAGE OF RENOVATION
- VIDEO – A DIGITAL DRILLING RIG, UNIQUE IN THE CIS, IS BEING COMMISSIONED AT KUMTOR