2017 Fourth Quarter and 2017 Year-end Results
published: 16 March 2018
Basic Operating and Financial Results
At the Kumtor mine gold production in 2017 was 562,749 ounces* or 17,503.46 kg.Gold sales in 2017 were 550,134 ounces * or 17,111.09 kg with a revenue totaling $685.2 million**. Contribution in to the national budget in taxes and mandatory payments in 2017 is more than 8.7 billion soms. The table below displays Kumtor”s basic operating and financial results:
| ($ millions*** , except as noted) | Three Months ended December 31 | Year ended December 31 | ||||
|---|---|---|---|---|---|---|
| 2017 | 2016 | % Change | 2017 | 2016 | % Change | |
| Revenue from gold sales to Kyrgyzaltyn – $ millions** | 228.1 | 231.3 | (1%) | 685.2 | 683.4 | 0% |
| Cost of sales – total | 84.7 | 103.0 | (18%) | 291.7 | 347.4 | (16%) |
| Cost of sales – $/oz sold**** | 468 | 537 | (13%) | 530 | 636 | (17%) |
| Tonnes mined – 000s | 50,770 | 35,543 | 43% | 181,878 | 144,399 | 26% |
| Tonnes ore mined – 000s | 2,607 | 223 | 1068% | 5,084 | 8,911 | (43%) |
| Average mining grade – g/t | 2.30 | 8.62 | (73%) | 2.12 | 3.45 | (39%) |
| Tonnes milled – 000s | 1,668 | 1,581 | 6% | 6,246 | 6,303 | (1%) |
| Average mill head grade – g/t | 3.76 | 4.71 | (20%) | 3.58 | 3.44 | 4% |
| Mill Recovery – % | 80.4% | 83.5% | (4%) | 79.1% | 79.2% | (0%) |
| Mining costs – total ($/t mined material) | 1.08 | 1.24 | (13%) | 1.10 | 1.27 | (13%) |
| Milling costs ($/t milled material) | 9.16 | 9.37 | (2%) | 10.69 | 9.87 | 8% |
| Gold produced – ounces | 158,165 | 200,762 | (21%) | 562,749 | 550,960 | 2% |
| Gold produced – kg | 4,919.49 | 6,244.40 | (21%) | 17,503.46 | 17,136.78 | 2% |
| Gold sold – ounces | 180,703 | 191,842 | (6%) | 550,134 | 546,342 | 1% |
| Gold sold – kg | 5,620.50 | 5,966.96 | (6%) | 17,111.09 | 16,993.15 | 1% |
| Average realized gold price – $/oz**** | 1,262 | 1,206 | 5% | 1,245 | 1,251 | (0%) |
| Capital expenditures (sustaining)**** – cash | 16.5 | 11.5 | 44% | 60.6 | 61.0 | (1%) |
| Capital expenditures (growth)**** – cash | 7.1 | 1.4 | 399% | 18.1 | 14.8 | 23% |
| Capital expenditures (stripping)**** – cash | 24.4 | 42.9 | (43%) | 149.4 | 100.5 | 49% |
| Capital Expenditures (stripping) – non-cash | 7.5 | 15.4 | (52%) | 50.9 | 36.2 | 40% |
| Capital expenditures (total) | 55.5 | 71.2 | (22%) | 279.0 | 212.5 | 31% |
| Operating costs (on a sales basis)***** | 44.9 | 43.1 | 4% | 146.0 | 167.4 | (13%) |
| All-in sustaining costs (including taxes) | 95.1 | 103.1 | (8%) | 383.9 | 349.2 | 10% |
| Adjusted operating costs – $/oz sold**** | 297 | 253 | 18% | 313 | 342 | (8%) |
| Operating Costs (on a sales basis)***** – $/oz sold | 249 | 224 | 11% | 265 | 306 | (13%) |
| Gold – All-in sustaining costs on a by-product basis – $/oz sold**** | 526 | 538 | (2%) | 698 | 640 | 9% |
| Gold – All-in Sustaining costs on a by-product basis including taxes – $/oz sold**** | 704 | 707 | (0%) | 874 | 815 | 7% |
*–One Troy ounce equals to31.10348 grams.
** –Unless specified otherwise, all dollar figures in this news release are in US dollars.
*** –Numbers may not add up due to rounding.
**** –Adjusted operating costs per ounce sold, operating costs (on a sales basis) ($ and per ounce sold), all-in sustaining costs (including taxes), gold all-in sustaining costs on a by-product basis per ounce sold (including and excluding taxes), as well as average realized gold price per ounce sold and capital expenditures (sustaining and growth) are non-GAAP measures and are discussed under “Non-GAAP Measures” in Centerra’s news release dated February 23, 2018.
*****-Operating costs (on a sales basis) is comprised of mine operating costs such as mining, processing, site support administration and production taxes (except at Kumtor where revenue-based taxes are excluded), but excludes reclamation costs and depreciation, depletion and amortization.
Kumtor’s Contributions in Taxes and Mandatory Payments for the Twelve Months of 2017
| As of December 31, 2017. | USD | |||||
|---|---|---|---|---|---|---|
| Q1 2017 | Q2 2017 | Q3 2017 | Q4 2017 | Total | ||
| Gross Proceeds Tax | 23,168,141 | 27,041,241 | 22,671,153 | 20,668,944 | 93,549,480 | |
| Issyk-Kul Development Fund | 1,389,468 | 2,472,792 | 1,743,935 | 822,612 | 6,428,807 | |
| Pollution tax | 310,000 | – | – | – | 310,000 | |
| Employee Income tax | 1,245,567 | 1,173,336 | 987,757 | 1,186,260 | 4,592,921 | |
| Social Insurance Fund | 5,673,426 | 4,984,932 | 4,811,394 | 4,579,019 | 20,048,771 | |
| Customs | 148,828 | 139,379 | 95,362 | 93,163 | 476,732 | |
| Tax on nonresident companies | 168,592 | 152,640 | 84,533 | 156,892 | 562,657 | |
| Other taxes and mandatory payments | 114,487 | 236,483 | 62,131 | 142,441 | 555,542 | |
| Total | 32,218,509 | 36,200,803 | 30,456,265 | 27,649,332 | 126,524,909 | |
| US$ official exchange rate to the Kyrgyz Soms as of end of Quarter | 68.6069 | 69.1367 | 68.6585 | 68.8395 | – | |
| Equivalent of payments effected in thousand Kyrgyz Soms | 2,210,412,018 | 2,502,804,052 | 2,091,081,501 | 1,903,366,178 | 8,707,663,748 | |
Note: Under the Agreement on New Terms dated as of April 24, 2009, the revenue-based tax and contributions to the Issyk-Kul Region Development Fund are estimated based on actual cash revenues from sales during the period under review.
Payments within the Kyrgyz Republic
Contributions made within the Kyrgyz Republic in 2017 (including taxes, refining, domestic suppliers, infrastructure, charities, etc.) have exceeded US $269.731 million. In all, contributions made within the Kyrgyz Republic between 1994 and 2017 have exceeded US $3,472billion.
| USD millions | 2017 | 1994 – 2017 |
|---|---|---|
| Taxes, customs & other mandatory payments | 99.314 | 1,083.889 |
| Social Insurance Fund | 20.049 | 187.845 |
| Issyk-Kul Development Fund | 6.429 | 62.634 |
| Licenses & permits | 0.423 | 3.809 |
| Pollution tax and payments to the Environment Protection Agency | 0.310 | 5.299 |
| Payments to Kyrgyzaltyn | 0.521 | 13.340 |
| Refinery | 4.364 | 55.265 |
| Revenue from the sale of Centerra shares | – | 86.000 |
| Dividends | – | 93.315 |
| Purchases in the Kyrgyz Republic:
– supplies & services |
44.468 | 771.727 |
| – foods | 4.317 | 69.540 |
| Kyrgyz-infrastructure-related payments:
– electricity |
12.869 | 179.470 |
| – roads outside the mine site | 1.742 | 44.487 |
| – Tamga-Kumtor power-transmission line | – | 41.612 |
| KGC employees” net wage | 66.428 | 695.627 |
| Sanatoria treatment | – | 0.744 |
| Education, scholarships & training | 0.581 | 6.398 |
| Sponsorships & sustainable development projects | 0.916 | 29.039 |
| Government contributions | – | 31.000 |
| Cancer Care Support Fund | 7.000 | 7.000 |
| Payments to communities | – | 4.400 |
| Total | 269.731 | 3,472.44 |
Kumtor”s Impact on the Macroeconomic Performance of the Kyrgyz Republic According to preliminary reports of the KR National Statistics Committee,
-
Kumtor”s share in KR GDP in 2017 was 9.7%;
-
Kumtor”s share in the aggregate industrial output was 21.1%.
Outlook for 2018 Kumtor’s 2018 gold production forecast is expected to be in the range of 450,000 to 500,000 ounces with about 45% of the gold production expected in the fourth quarter. In 2018, Kumtor’s all-in sustaining cost on a by-product basis 3 is expected to be in the range of $733 to $815 per ounce sold. At Kumtor, 2018 total capital expenditures, excluding capitalized stripping, are forecast to be $63 million. Spending on sustaining capital 3 of $49 million relates primarily to major overhauls and replacements of the heavy duty mine equipment ($42 million). Growth capital 3 investment at Kumtor for 2018 is forecast at $14 million primarily related to tailings dam construction ($9 million). The cash component of capitalized stripping costs related to the development of the open pit is expected to be $122 million of the $168 million total capitalized stripping estimated in 2018.
CEO Commentary
Scott Perry, President and Chief Executive Officer of Centerra Gold stated, “I am pleased to report that Centerra met its overall gold production guidance producing 785,316 ounces at an all-in sustaining cost on a by-product basis of $688 per ounce sold 3 , beating the low-end of our all-in-sustaining cost 3 guidance for the year. Kumtor had another strong year exceeding its revised production guidance and beating its all-in-sustaining cost guidance, delivering 562,749 ounces of gold production at all-in-sustaining cost on a by-product basis of $698 per ounce sold 3 in 2017.
***
The Kumtor open pit mine , located in the Kyrgyz Republic, is one of the largest gold mines in Central Asia operated by a Western-based gold producer. It has been operating since May 1997 and has produced over 11.5million ounces or 357 tonnes of gold to December 31, 2017.
Kumtor Gold Company is the operator of the Kumtor Project responsible for the entire production cycle.
Centerra Gold Inc. is a Canadian-based gold mining company focused on operating, developing, exploring and acquiring gold properties in North America, Asia and other markets worldwide. Centerra operates two flagship assets, the Kumtor Mine in the Kyrgyz Republic and the Mount Milligan Mine in British Columbia, Canada and is the largest Western-based gold producer in Central Asia. Centerra’s shares trade on the Toronto Stock Exchange (TSX) under the symbol CG. The Company is headquartered in Toronto, Ontario, Canada.
The Kyrgyz Republic, via Kyrgyzaltyn JSC, is Centerra”s largest shareholder owning 77,401,766 common shares. As of March 14, 2018, Kyrgyzstan”s interests were estimated at $425 million .
Additional information on Centerra and the full text of the news release on the fourth quarter 2017 year-end results are available on SEDAR at www.sedar.com and the corporate websites at www.centerragold.com and www.kumtor.kg .
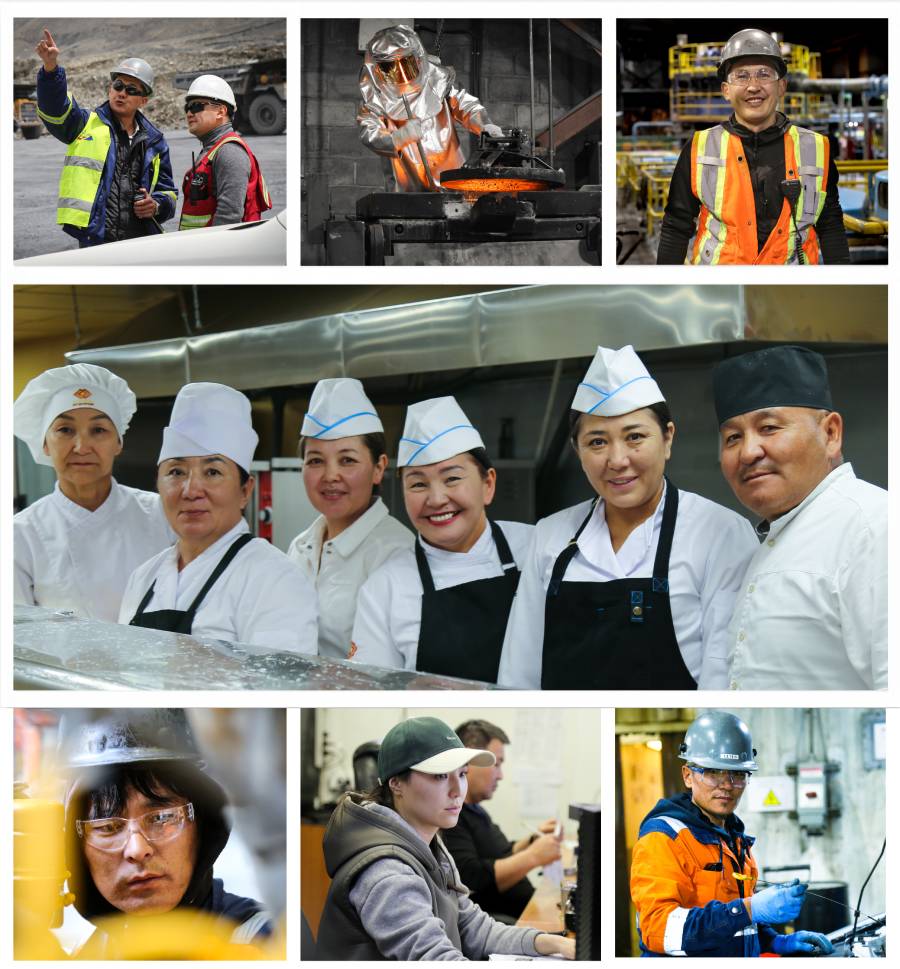
Kumtor Gold Company provides jobs for over 3000 people.
99 percent of the Company full-time employees are Kyrgyz citizens, and this proportion is ever growing as the result of foreign managerial personnel being gradually replaced by national employees.
WORKFORCE
As of 31.05.2026, according to the HR management system, the Kumtor Gold Company has
3 579
Full-time
employees

8
Expatriate specialists
3 571
Citizens of the Kyrgyz Republic

Latest news
- KUMTOR: MORE THAN USD 1.2 BLN CONTRIBUTED TO THE STATE BUDGET DURING 4.5 YEARS OF STATE MANAGEMENT
- VIDEO – HAPPY METALLURGISTS’ DAY!
- KUMTOR TRANSFERRED KGS 19 BLN TO THE STATE BUDGET DURING THE FIRST SIX MONTHS OF 2026
- KANIMET TOKTOSUNOV: THE EPC CONTRACTOR FOR THE CONSTRUCTION OF THE TOGOLOK DEPOSIT FACILITIES IS CHINA NERIN ENGINEERING
- SPECIAL EDITION: TOGOLOK